
How To Use Your Hoymiles Solar Monitoring
How to Use Your Solar Monitoring: Hoymiles
Web browser access
1. Got to: https://global.hoymiles.com/platform/login
You will first see your main Dashboard

Main Dashboard
1. Navigation bar between Dashboard, Layout, Devices and Settings.
2. Realtime system production in kilo-watts (kW).
3. System performance summary.
4. Plant Status that shows the system and network status for the system.
5. System and personal information.
6. System performance report for various timeframes.
7. Financial and Environmental metrics for the system.
8. Daily Production Comparison. Show the difference in production from one day to the next.

Layout
9. Summary of the output of the panels. This is based on the options set in 2.
10. Options and dates for panel performance summary. Change the settings to select the date or range of dates you need data for.

Devices
See a list of the inverters and the installed ECU. This also shows the status of the various devices.

Specific Device
Click on the serial number to see the specific devices info.
This page will show you details of that devices production, voltage and other technical information. This information is also important when troubleshooting the system.
Mobile Device Access
S-Miles End user is a mobile application developed by Hoymiles especially for owners of distributed PV power plants. There are more functions, such as module-level monitoring, real-time data display for both plant-level & module-level as well as daily, monthly, annual, and total energy display. Furthermore, you can easily see the alarm information with the equipment, which could assist the owner in monitoring the operation of the PV power plant, ensuring normal operation of the power plant and obtaining of the expected yield.

Getting the mobile app
Use your iOS (Apple) or Android mobile device camera to scan the QR code above or search your App Store or Google Play Store for the “S-miles Enduser”. Download and install this free application.

Log in
Once it has successfully installed, you will need to enter your username in the Login Account and your Password.
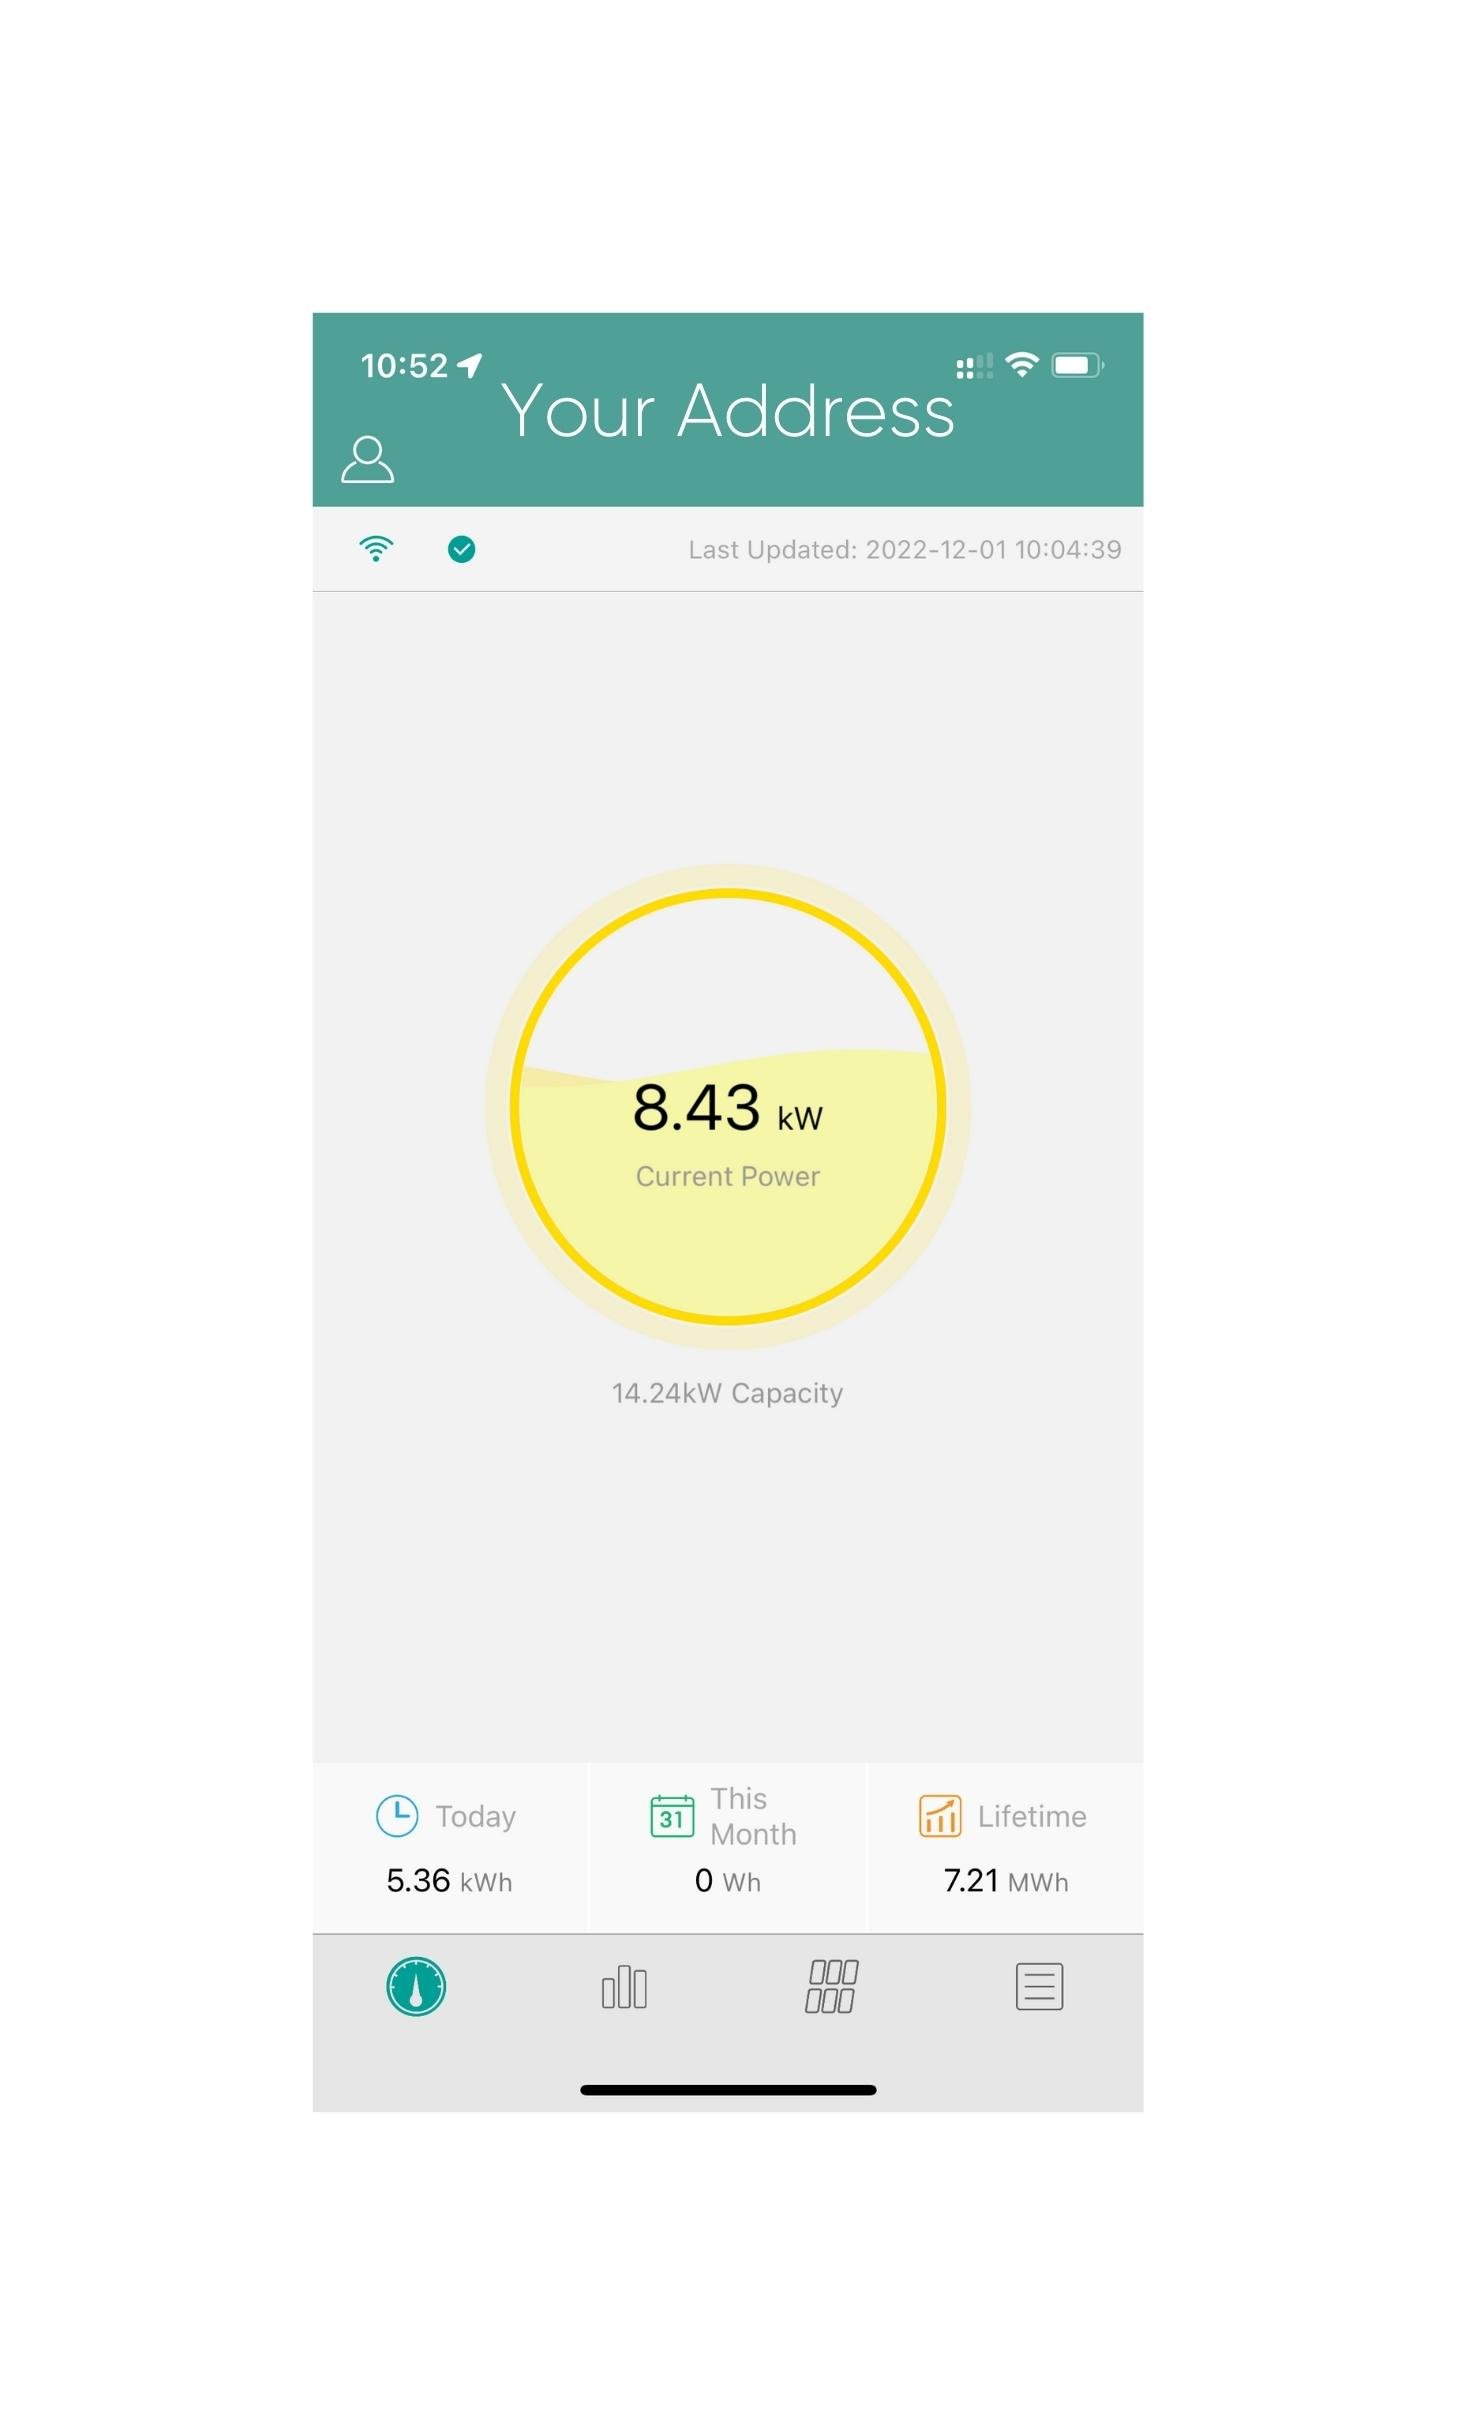
System Summary
You'll see how much power your system is producing, and how much energy your system is producing (yes, these are different values - a good analogy is to think of the power as the speed of your car, and the energy as the distance you've actually driven). You will see your energy produced today, this month, and in the system's lifetime. Along the bottom is the Navigation Bar. Tap on the icon with the 3 vertical bars.
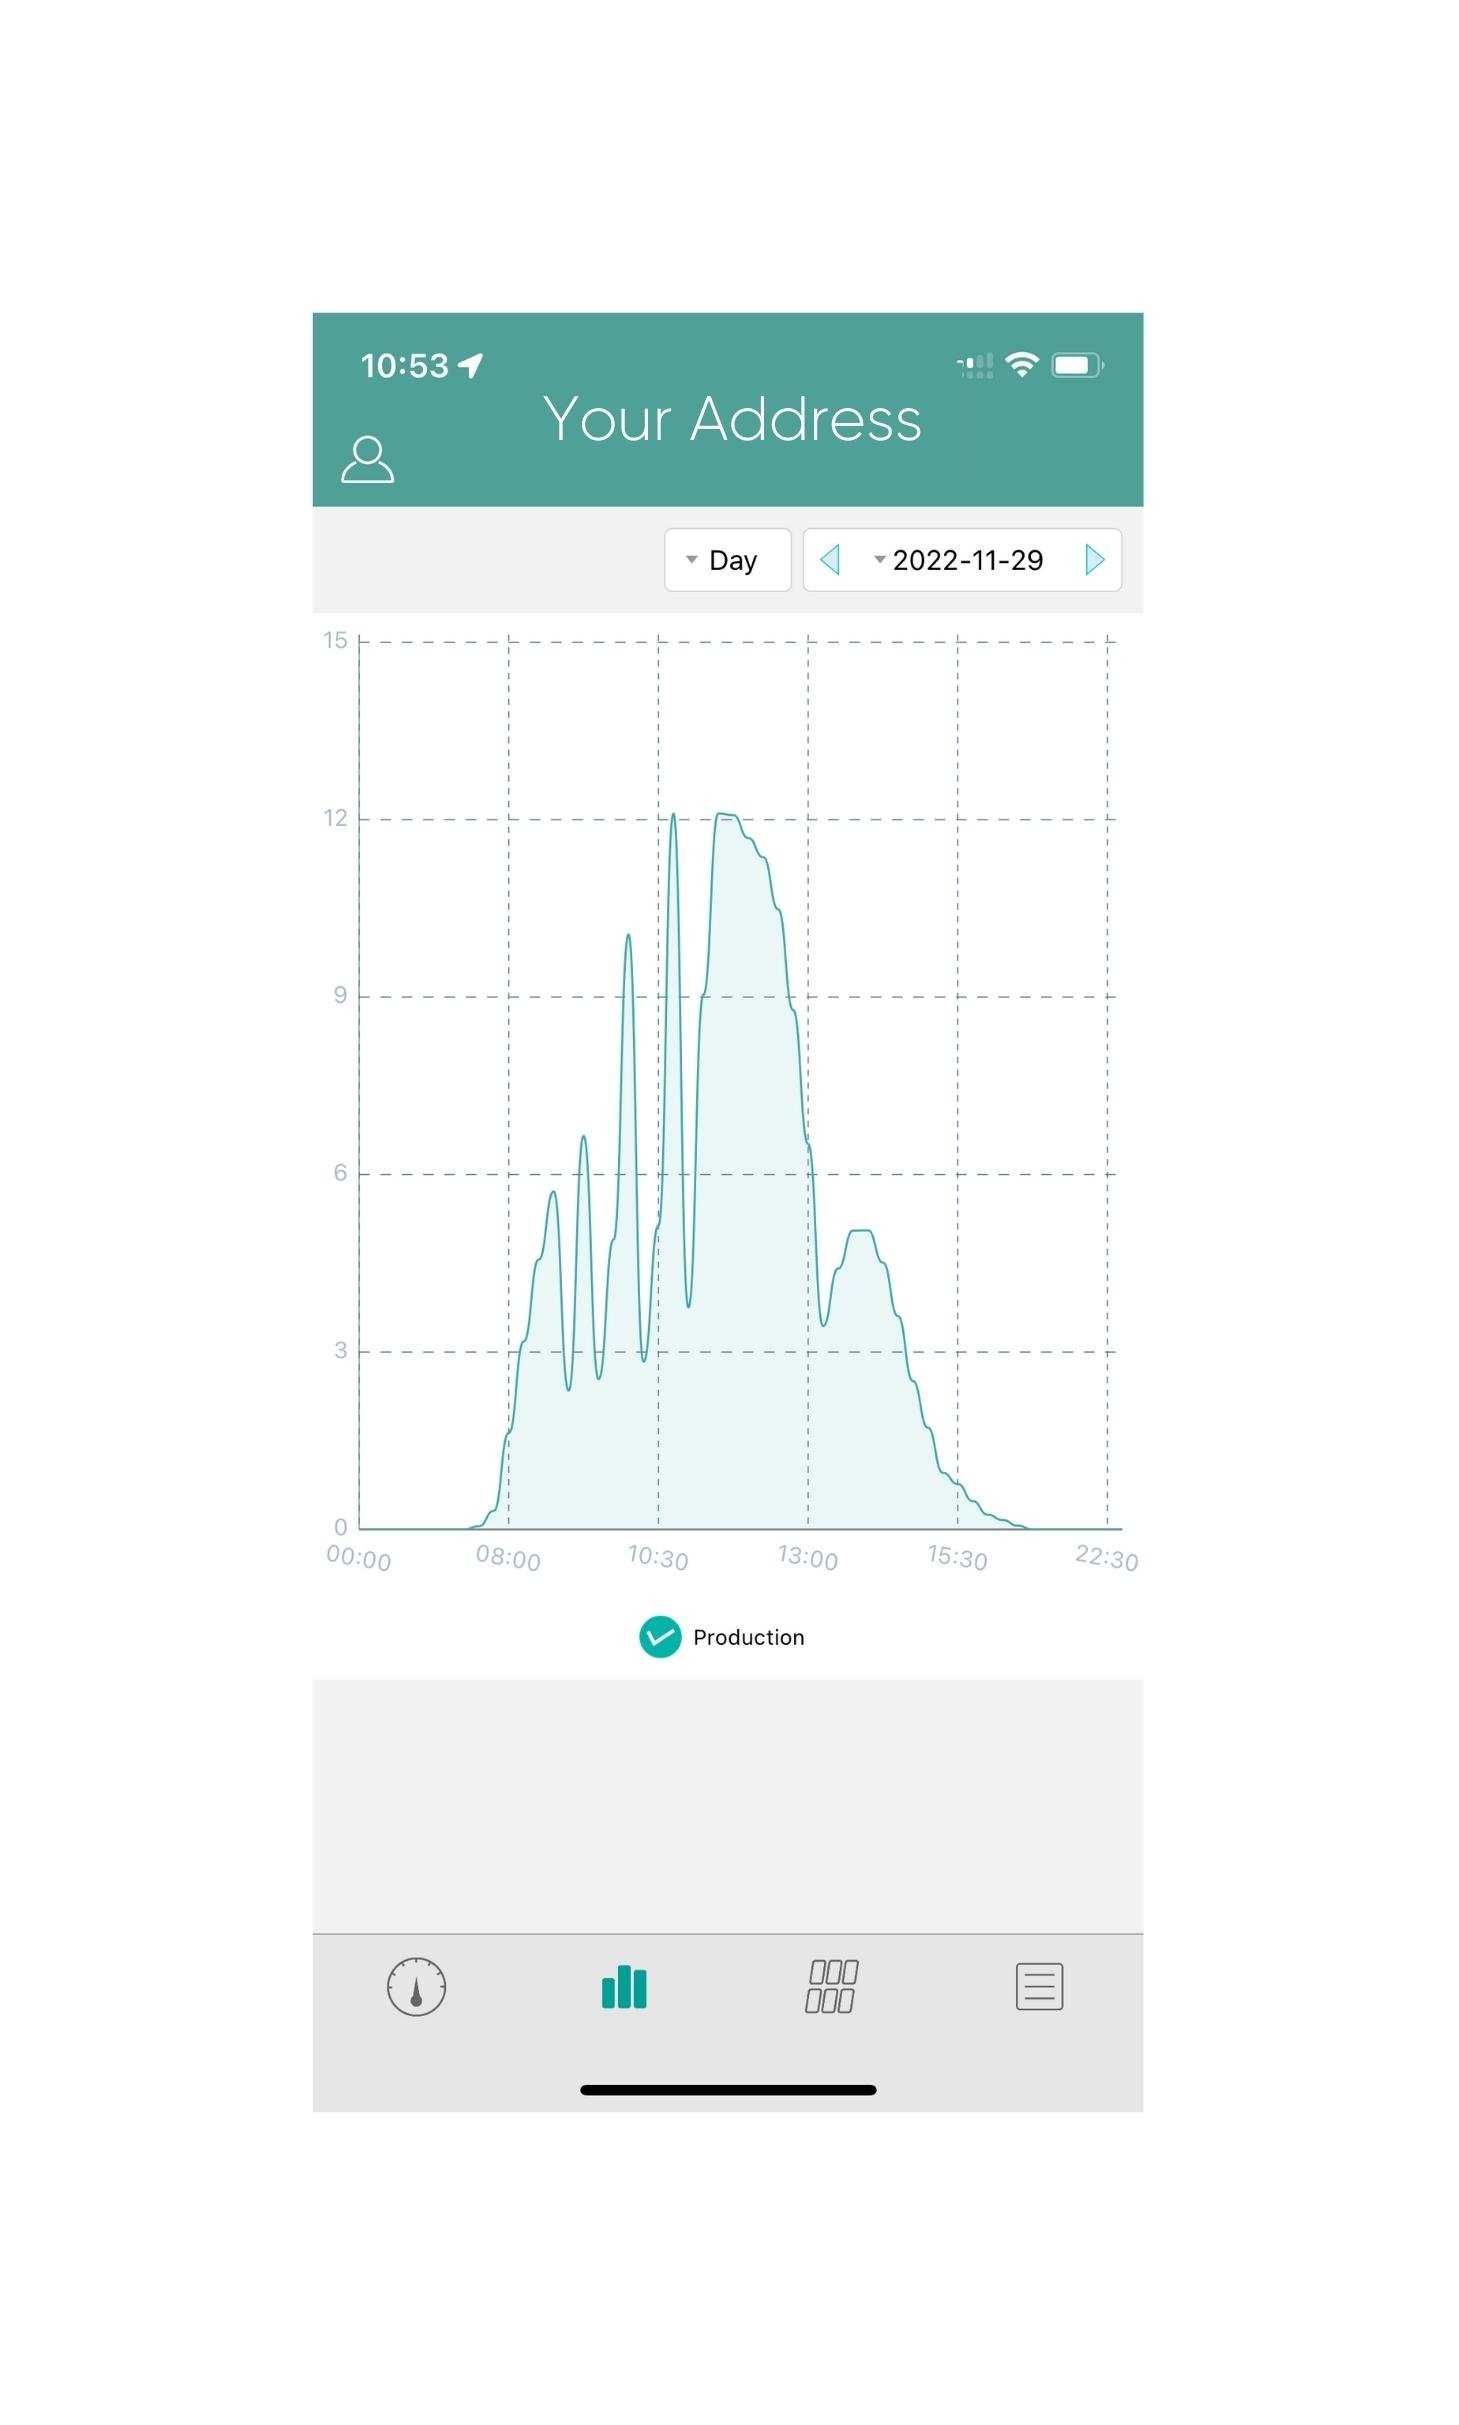
System Performance
Change the dates at the top right to get different perspectives on your generation.
Tap on the 6 rectangles at the bottom to see your layout.
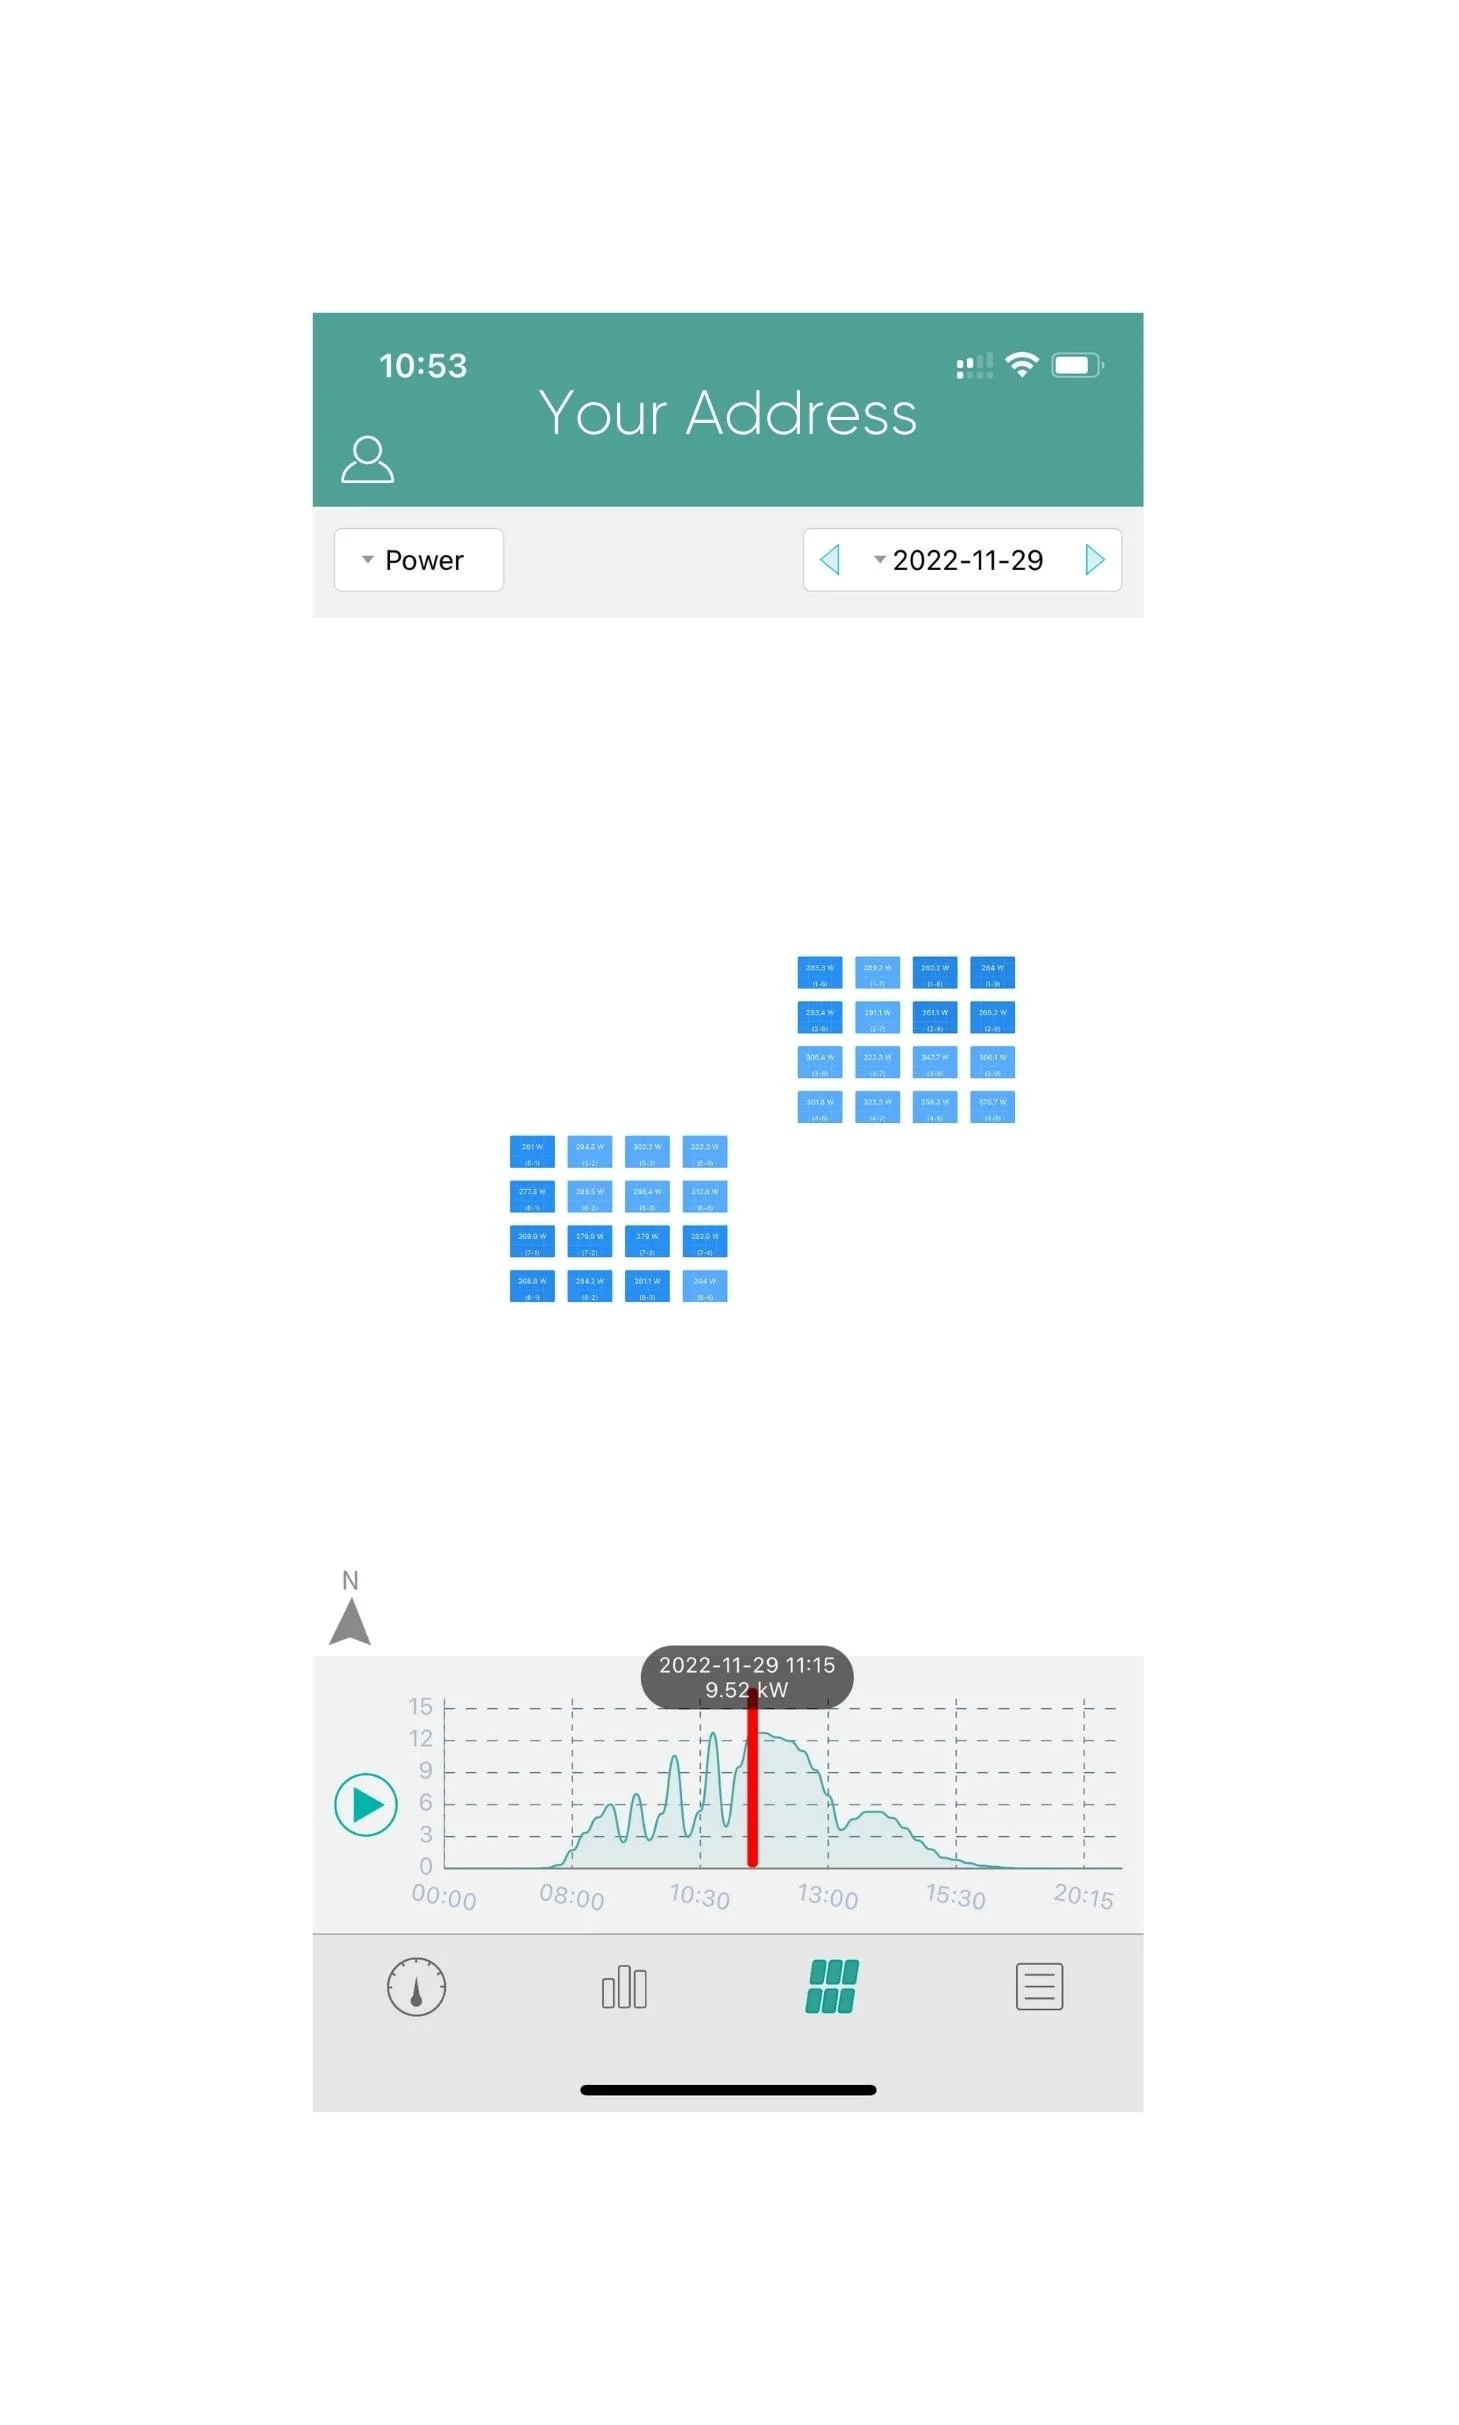
Layout
This will show you the layout of your panels and the performance of each panel. You can actually tap on each panel to get more information and data.
The last icon on the bottom right has all the personal, system and device information you’ll need to identify and troubleshoot your system.